 |
|
|
Ridership AnalysisDetermining ridership on the Downtown Relief Line is a difficult challenge; accuracy can only be ensured through the use of traffic modeling software, such as EMME/2. Without the use of such software, modeling becomes an educated guess to determine ridership based upon modal shares, intersecting bus routes, and population density, among other factors. The specifics of how ridership was determined for this document can be found in the methodology page. Why Ridership Estimates were limited to Wynford-CityplaceRidership estimates were limited to Stage One of construction due to the lack of accuracy in estimating ridership over a long-term spectrum. Significant development or changes in travel patterns and demand can change over time, making any estimates of ridership for future stages of the Downtown Relief Line no more than a guess. By limiting estimates to Stage One, 2014 projected density figures can be used, and modal splits are less likely to significantly change. Potential for UnderestimationThe figures used for determination of ridership may actually be underestimated, as construction on the Downtown Relief Line would not finish until at least 2020105. Ridership estimates are based upon 2014 density figures, which are likely to increase, and subway and bus ridership figures from 2008-2009, which will almost certainly be higher by 2020. Given the projections of Yonge ridership to 2031, it would not be surprising if estimates for ridership were underestimated by upwards of 4,000 passengers in the AM Peak Hour. Therefore, ridership estimates will be given as a range, with the lower end being the calculated ridership and the upper end being assumed possible growth. Type of Ridership DeterminedRidership on the Downtown Relief Line was determined for the AM Peak Hourin the South/Westbound direction, ie. the direction heading downtown and thus accommodating the greatest deal of ridership. This is when the Yonge subway reaches peak capacity, and the Downtown Relief Line can effectively serve one of its most important purposes. New Ridership GeneratedIn the south/westbound direction during the peak hour, the Downtown Relief Line is expected to generate new ridership of between 5,500 and 6,000 passengers. Approximately ¼ to 1/3 of these passengers are a result of major new construction along the Esplanade part of the alignment. This would mean new ridership would total approximately 16% of the total ridership on the line, and could take between 4600 and 5000 cars off the road in the peak hour, which is approximately 75-80% of the capacity of the Don Valley Parkway172. Existing Yonge Ridership Displaced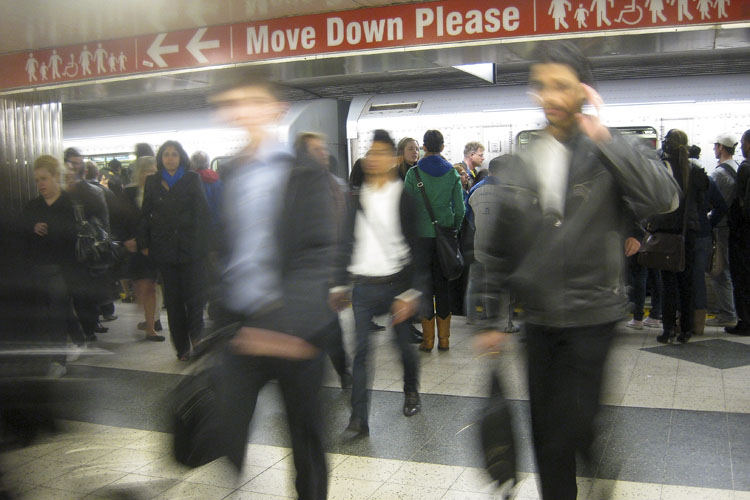 The Yonge Subway would no longer be overcapacity as a result of the DRL. Ridership on the Yonge line would see a drop of approximately 20,000 riders in the peak hour, the majority of which would come from the Bloor-Yonge transfer (12,300). This does not mean peak ridership would drop on the Yonge line to 10,000, as passengers embark and disembark at various points throughout the line, making peak ridership a fraction of total embarkments in the AM Peak. It is, however, a significant amount of riders displaced, and at the very least the 12,300 passengers who would no longer transfer at Bloor-Yonge would be taken away from peak ridership levels, as that is the area at which ridership on the Yonge subway peaks. This means Yonge may see new ridership as a result of increased comfort and capacity. Estimated Peak Hour Ridership for Downtown Relief LineEstimated peak ridership for the Downtown Relief Line is between 24,000 and 28,000 in the area between Cherry and St. Lawrence stations. With capacity of the line at 33,000 with new Toronto Rocket trains, this would distribute ridership to reasonable levels among Toronto’s different subway lines, and significantly relieve overcrowding while acting as an important commuter line in and of itself due to the neighbourhoods that it serves172. Potential for Off-Peak RidershipWhile demand for off-peak ridership is not as necessary to calculate, it should be noted that the Downtown Relief Line provides significant potential for off-peak ridership, with several destinations that would generate high levels of traffic even in non-peak times. Rogers Centre station is within very close walking distance of Rogers Centre and the Air Canada Centre for sporting events and concerts, the CN Tower, and the Metro Toronto Convention Centre. St. Lawrence Market, The Distillery District, and The Ontario Science Centre also exist along the line as notable trip generators to ensure the line’s success even during mid-day and evening. ConclusionThe Downtown Relief Line not only will generate a significant amount of ridership, but reduce strain on existing subway lines. The ridership levels it will generate are well suited to heavy-rail subway technology, with its capacity of 33,000 passengers per hour. It is an obvious solution to Toronto’s current transportation problems. Image SourcesFrom top to bottom:
|